Usage statistics overview
Where to see the storage, traffic, encoding, and Box figures of a Project and of a whole company.
- Projects
- ProductionArchive
- Roles
- ManagerOwnerAdministrator
- Updated
Mnemonica shows you how much of each resource a Project uses. You can see the figures for one Project, or for all the Projects of a company.
- Managers see the figures of the Project they work in. Operators, Power Guests, and Guests do not see the Usage overview icon.
- Company Administrators see the figures of all the Projects of the company, in the Company panel.
The figures are updated regularly. They can be slightly different from the real values.
See the usage of one Project
Open the Project
Click Projects in the bottom bar, then click the Project.
Click the Usage overview icon
At the top of the page, click the bar chart icon, next to the gear and information icons.
The Usage stats window opens.
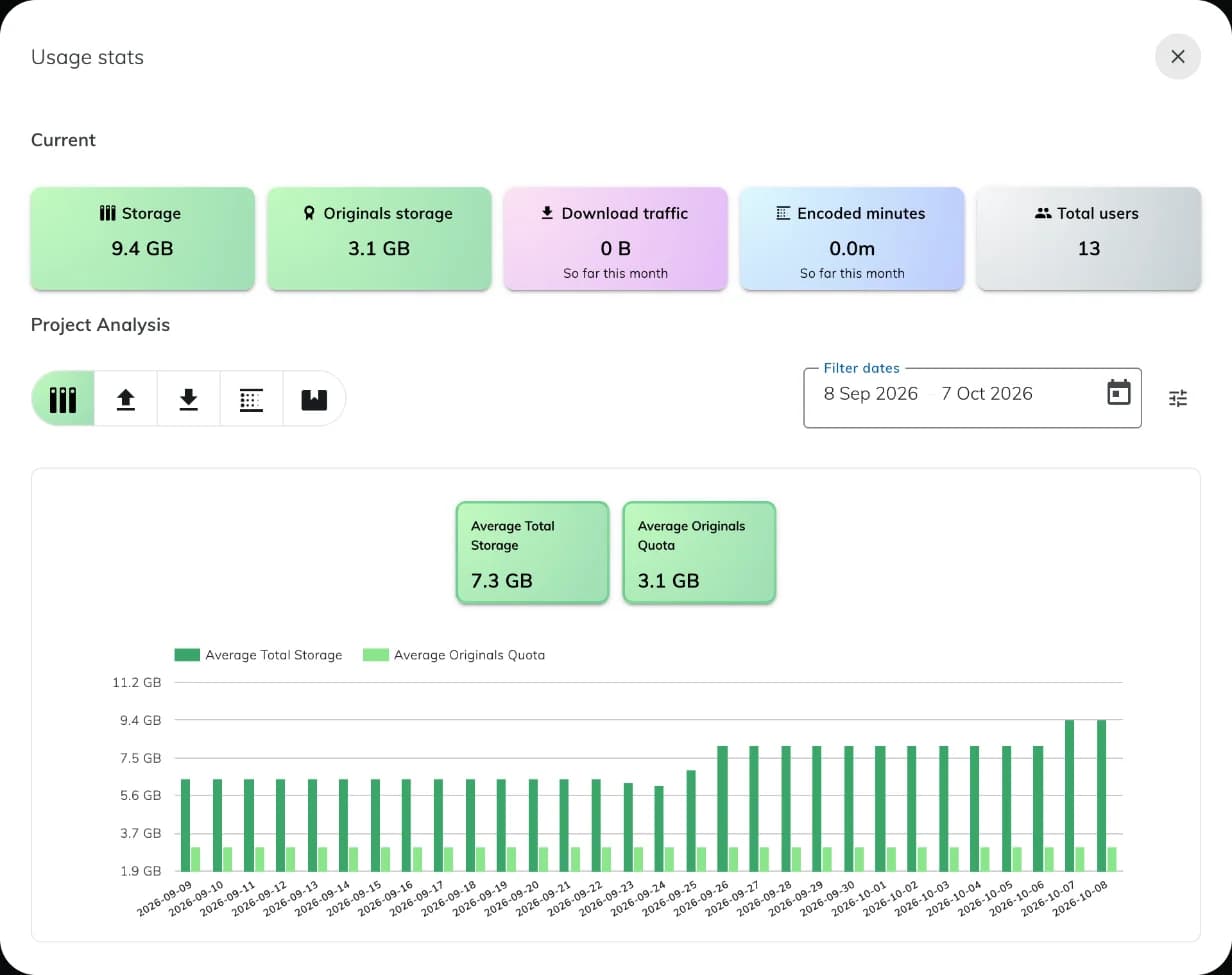
The Current section shows five cards:
- Storage: the total size of the Project.
- Originals storage: the part of the storage used by original files.
- Download traffic: the traffic of this month, so far.
- Encoded minutes: the minutes of video that Mnemonica encoded this month, so far.
- Total users: the number of users in the Project.
The Project dashboard also shows a short Usage data line with the same figures, except Originals storage.
Analyze a period
The Project Analysis section shows how the figures change in time. Use these buttons to choose what you see:
| Button | What it shows |
|---|---|
| Storage | Average Total Storage and Average Originals Quota. |
| Upload | Total Upload Traffic, Uploaded to Screening Rooms, and Uploaded to Boxes. |
| Download | Total download traffic, Downloaded from Screening Rooms, Downloaded from Boxes, and Streaming. |
| Encoding | Minutes of encoded video, split into optimized and watermarked video. It also shows the number of encoded, optimized, and watermarked clips. |
| Boxes | Sent Boxes, Total Boxes Size, Total Files into Boxes, and Box Deliveries. |
By default, the chart shows the last 30 days. To change the period, use the Filter dates field. Or click the filter icon next to it and choose a preset: Last 30 days, This week, Last week, This month, Last month, This quarter, Last quarter, This year, or Last year.
See the usage of a company
Open the Company panel
Click your avatar in the bottom left corner and choose Company.
Choose the company
If you manage more than one company, choose the company at the top of the left menu.
Click Usage stats
Click Usage stats in the left menu.
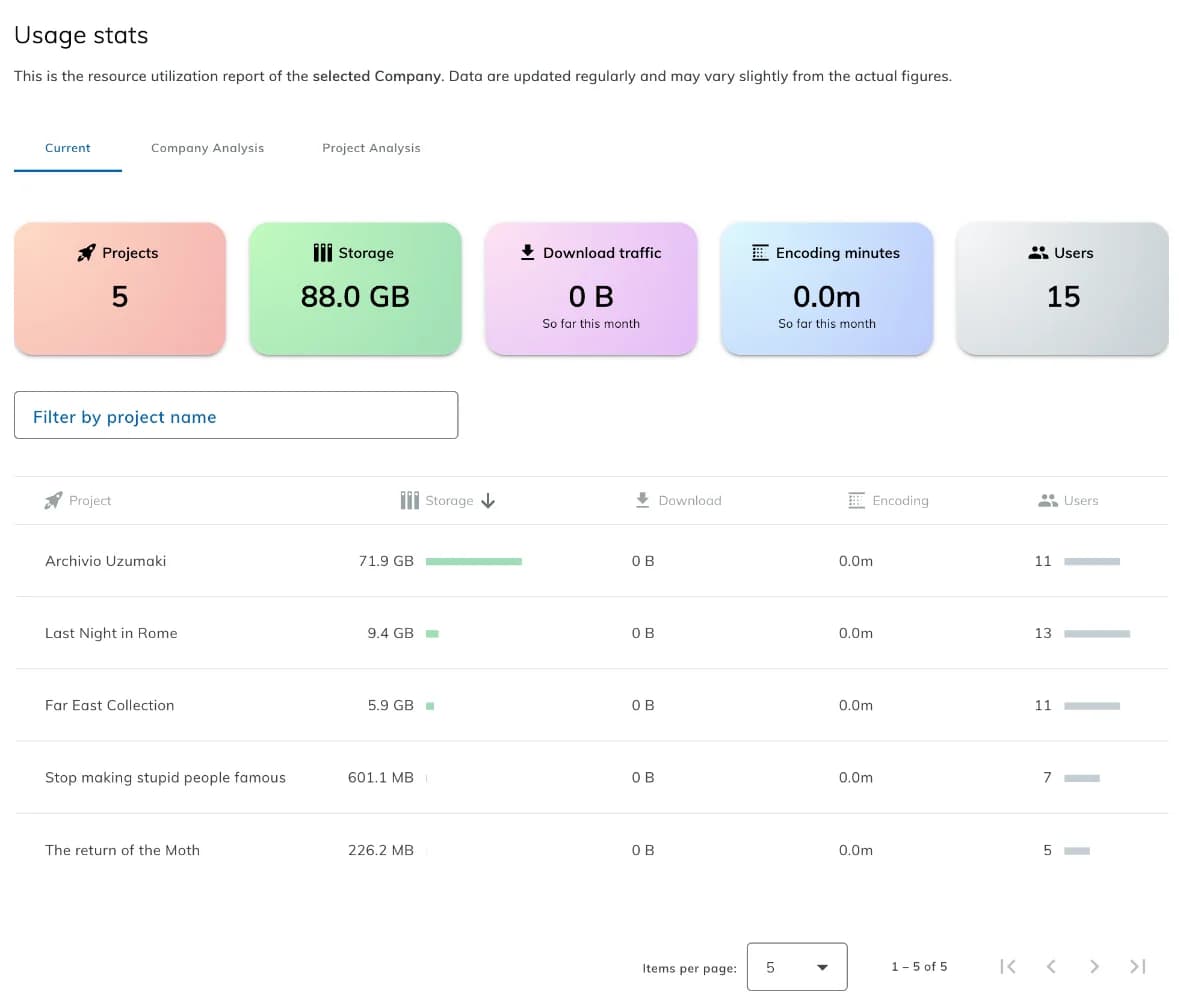
The page has three tabs:
- Current: five cards (Projects, Storage, Download traffic, Encoding minutes, Users) and a table with the same figures for each Project. Use Filter by project name to find a Project.
- Company Analysis: the charts of the whole company, with the same five buttons and the same date filter as in a Project.
- Project Analysis: the same figures, shown as a table with one row for each Project.